Attainment Data
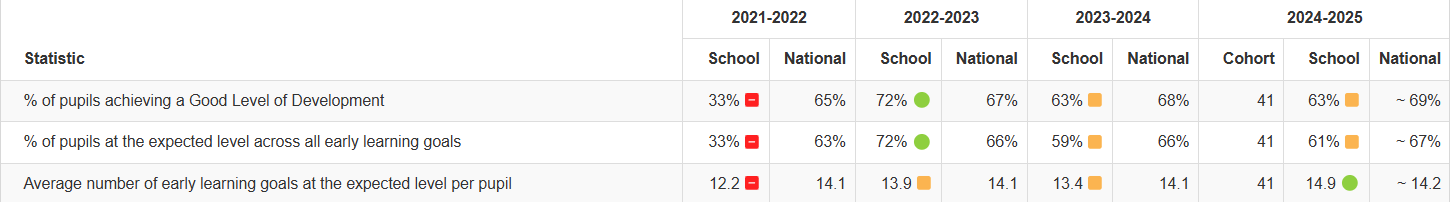
Early Years Foundation Stage
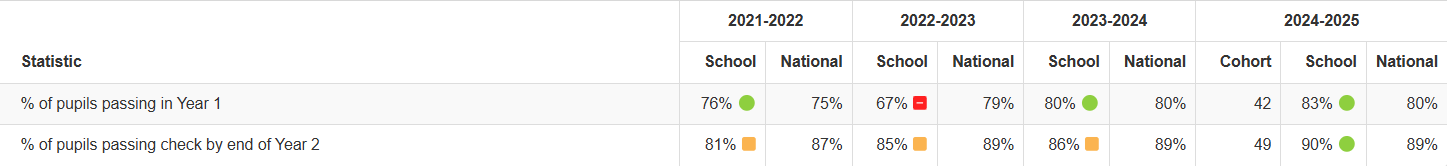
Phonics Screening Check
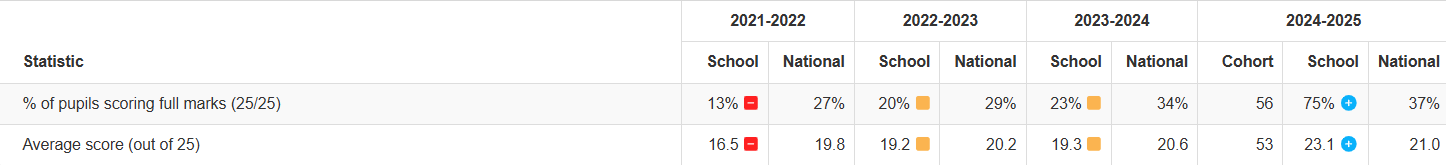
Multiplication Tables Check
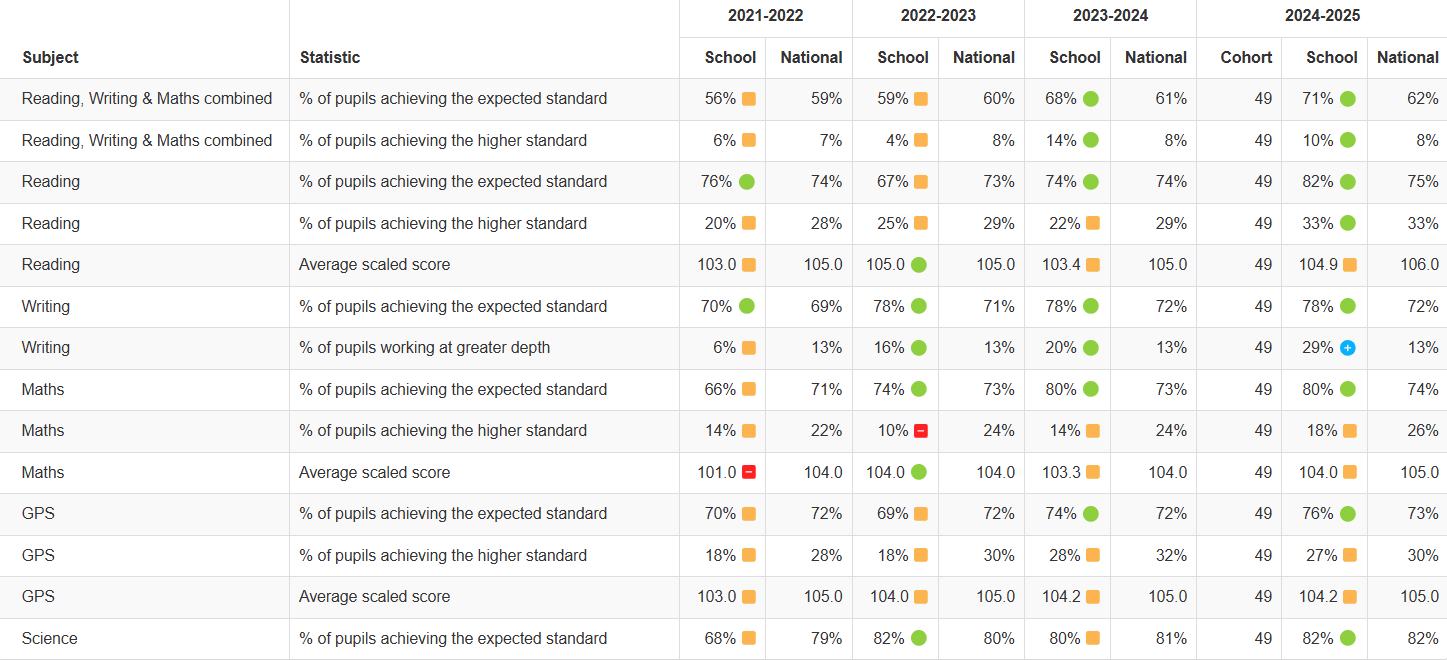
End of Key Stage 2 SAT Assessments
School Data Dashboard
To see how well our children are doing in tests and assessments, how well they make progress, their attendance and the achievement of our disadvantaged pupils, please follow the link below to view our school’s details:
Wellesbourne Primary School Data Dashboard (link opens in new window)
February 2026 Ofsted Report (document opens in new window)